
How many projects actually succeed, and what separates the ones that do from the ones that don’t? PMI’s 2025 Project Success study is one of the largest datasets on the question, drawn from 5,842 survey responses across 19 countries. Below are the key statistics, grouped by theme. Every figure comes from that research unless noted, and all are paraphrased from the source.
Contents
TL;DR
- The global Net Project Success Score (NPSS) sits at 37 in 2025, barely moved from 36 in 2024.
- Just half of projects (50%) deliver value worth the effort and expense; 13% are outright failures.
- A clear project vision is worth a 59-point NPSS swing (41 with one, -18 without).
- Only about 7% of project professionals consistently apply all four success behaviors PMI groups as M.O.R.E.
The state of project success
- The global NPSS is 37 in 2025, essentially flat against 36 in 2024. NPSS is calculated as the share of successful projects minus the share of failed ones.
- In 2025, 50% of projects delivered value worth the effort and expense, 37% had mixed results, and 13% were outright failures.
- The research is based on 5,842 survey responses from 19 countries, supported by roughly 48 practitioner interviews.
What a clear vision is worth
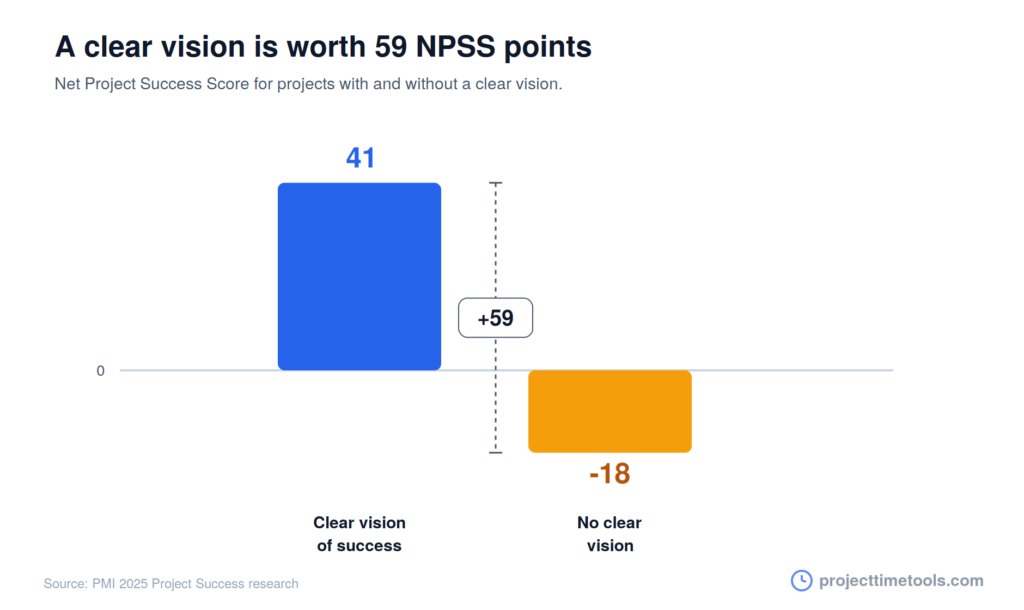
- Projects with a clear vision of success scored an NPSS of 41, versus -18 for those without one, a 59-point swing and the difference between likely success and likely failure.
- When end users and customers were aligned with the vision, NPSS reached 63, compared with 14 when they were not.
- When organizational executives were aligned, NPSS reached 57, versus 19 when they were not.
Measuring progress
- Only 37% of projects applied all three parts of what PMI calls the “measurement trifecta” (defining success criteria, a solid measurement system, and measuring toward outcomes throughout).
- Projects using all three scored an NPSS of 54, versus 31 for those missing one or more a 23-point difference.
- Breaking it down: 86% define success criteria up front, 76% have a well-established measurement system, but only 50% measure performance toward outcomes throughout the project.
Prioritizing value over rigid constraints
- Teams willing to flex time, cost, and scope in pursuit of greater value scored an NPSS of 60, versus 42 for teams rigidly focused on delivery an 18-point gap.
- Setting a bold, transformative goal lifted NPSS to 67, compared with 21 for moderately ambitious projects. Ambitious aims were associated with two to three times the success.
This is a useful reminder that the schedule is a means, not the goal. A realistic project timeline still matters, but the data says flexing it in service of value beats defending it at all costs.
The mindset that drives success
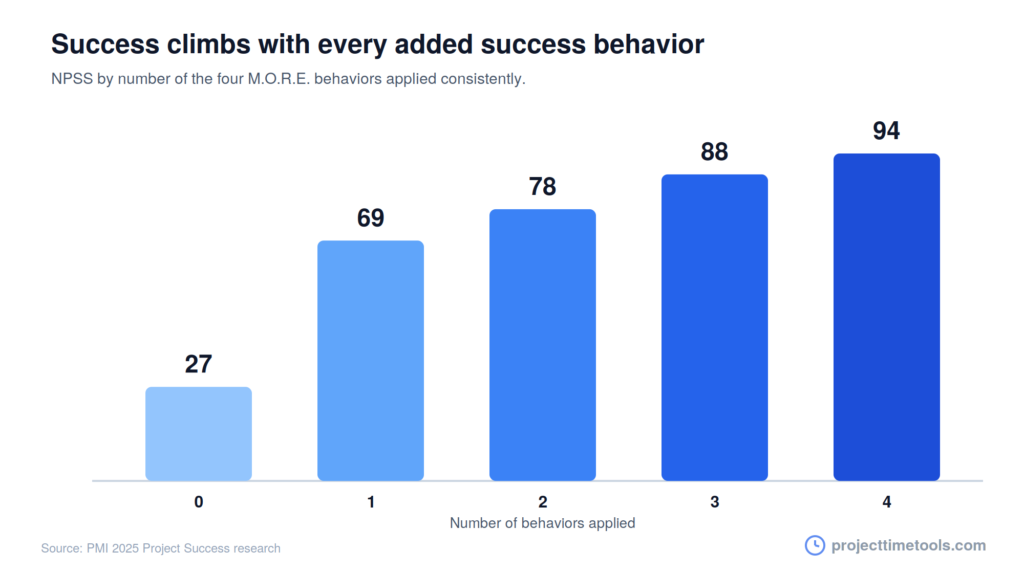
PMI groups four success behaviors under the label M.O.R.E.: manage perceptions, own success, relentlessly reassess, and expand perspective. The adoption data is striking.
- Applying all four behaviors lifted NPSS to 94; applying none scored 27. The score climbs with each one added: 27, then 69, 78, 88, and 94.
- Only about 7% of project professionals (roughly 1 in 14) apply all four consistently.
- Applying even one behavior consistently raised NPSS by 42 points over applying none.
- Individually, consistent adoption is low across the board: manage perceptions 27%, own success 30%, relentlessly reassess 28%, and expand perspective 24%. Less than a third apply any single one consistently.
- Pairing a clear vision with sustainability goals produced the largest swing in the study: up to a 90-point NPSS lift compared with projects that had neither.
Rescuing at-risk projects
- Nearly half of ultimately successful projects (45%) were at material risk of failure at some point before completion.
- The most effective recovery actions, by NPSS lift, were: adapting to external changes (+34), communicating challenges to stakeholders (+29), bringing in additional resources (+17), and revisiting the project timeline (+11).
The takeaway: when a project wobbles, adapting and communicating outperform simply adding people or pushing dates.
Who is expected to own success
- 69% of all stakeholders see project and program managers as primarily responsible for driving value.
- That expectation is even higher among leadership: 72% of sponsors, 74% of organizational executives, and 75% of project managers themselves point to the PM as the owner.
- 76% of professionals say their top motivation is to benefit their organization, project, or society, rather than personal career gain.
Success by industry, type, and funding
PMI’s appendix breaks average NPSS (2024-2025 combined) down by category. A few highlights:
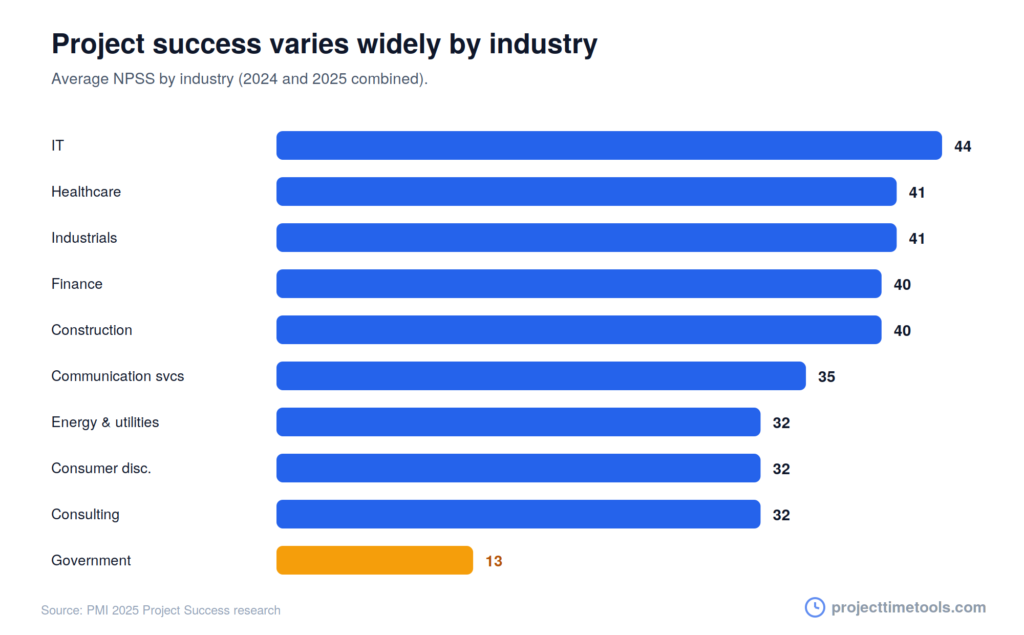
By industry: IT leads at 44, followed by healthcare (41), industrials (41), finance (40), and construction (40). Government trails badly at 13.
By project type: software product development scores highest at 45, then IT implementation and upgrades (43) and physical infrastructure (41). Functional line-of-business projects sit lowest at 25.
By funding source: non-profit and NGO projects top the list at 56, well ahead of internally funded work (38) and domestic government projects (25).
FAQs
According to PMI’s 2025 research, 50% of projects delivered value worth the effort and expense, 37% had mixed results, and 13% were outright failures. The global Net Project Success Score was 37.
NPSS is a measure PMI uses to gauge project success. It is calculated as the percentage of successful projects minus the percentage of failed ones, giving a single score that can be positive or negative.
In PMI’s data, mindset and approach mattered most. Projects led by professionals applying all four M.O.R.E. behaviors scored an NPSS of 94 versus 27 for those applying none. A clear vision alone was worth a 59-point swing.
In PMI’s 2025 study, 13% of projects were rated outright failures, while another 37% had mixed results. Only half were clear successes.
All figures are drawn from PMI’s 2025 Project Success research, published as Step Up: Redefining the Path to Project Success with M.O.R.E., based on 5,842 survey responses across 19 countries.