
Projects miss far more often than most teams admit. This article collects the clearest project failure statistics from two large practitioner studies: Wellingtone’s State of Project Management 2026 (hundreds of practitioners across 250+ organisations) and PMI’s 2025 Project Success research (5,842 responses across 19 countries).
Contents
TL;DR
- Only 36% of organisations reliably finish projects on time, and just 42% deliver the full benefits (Wellingtone).
- 13% of projects are outright failures and another 37% have mixed results, so only half clearly succeed (PMI).
- A third of projects are never baselined, so there is no plan to measure slippage against (Wellingtone).
- The top reason projects struggle is simply taking on too many at once (Wellingtone).
How often projects miss
- Only 36% of organisations mostly or always finish projects on time, so most miss deadlines at least some of the time (Wellingtone, 2026).
- Just 49% reliably finish on budget, and only 42% deliver the full benefits they set out to (Wellingtone, 2026).
- 13% of projects are outright failures and another 37% land in mixed territory, leaving only half as clear successes (PMI, 2025).
The success illusion
- 52% of organisations believe they have a track record of project success, well ahead of what their on-time (36%) and benefits (42%) numbers actually show (Wellingtone, 2026).
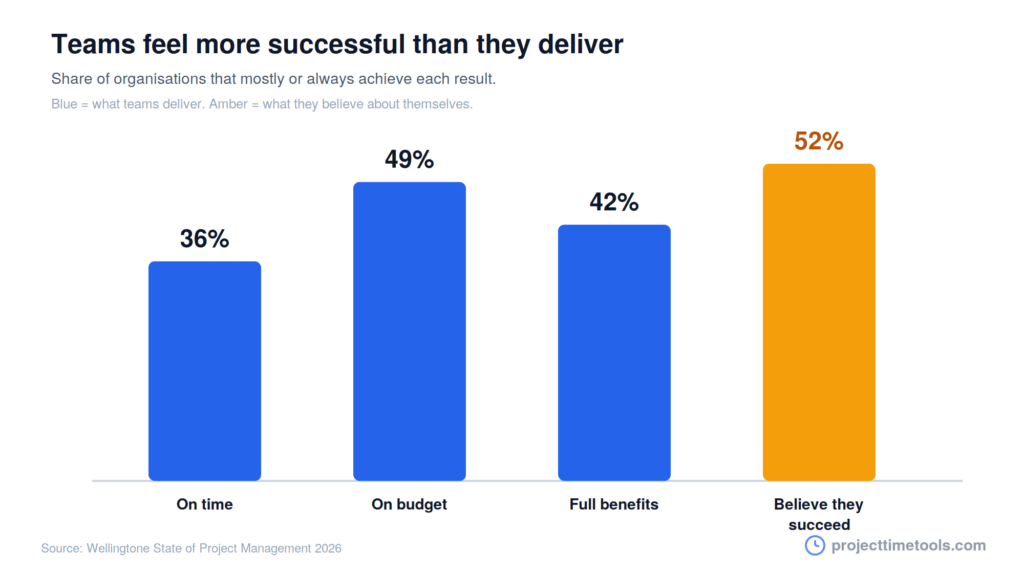
This gap is the most revealing failure statistic of all. Teams feel successful more often than their delivery data says they are, which means many problems go unaddressed because nobody thinks there is one.
Why projects fail: the basics are missing
Most failure traces back to fundamentals that were skipped, not to bad luck (Wellingtone, 2026).
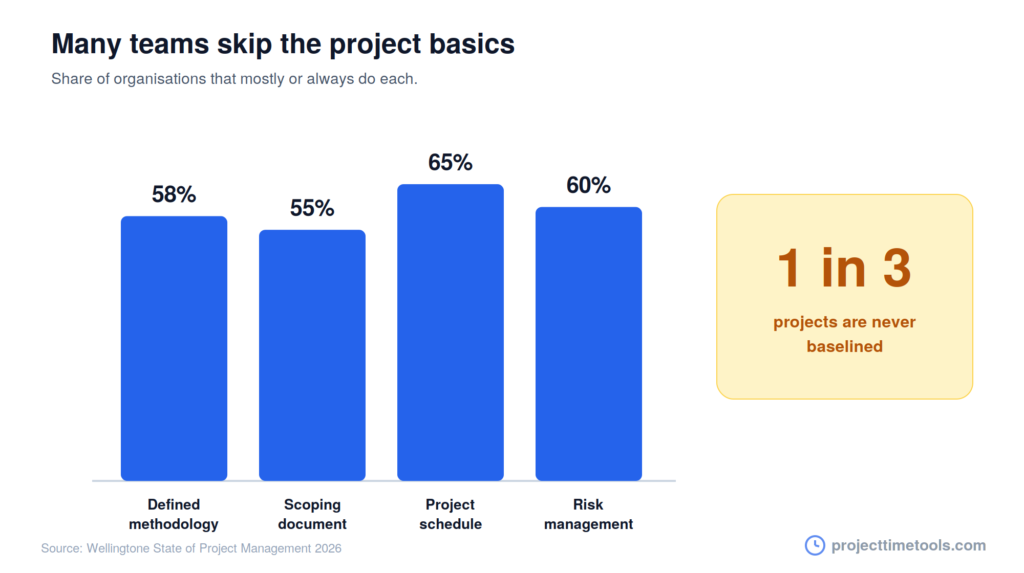
- A third of projects are never baselined, so there is no original plan to measure progress or slippage against.
- Around a quarter of projects run without a defined methodology (only 58% mostly or always apply one).
- Only 55% create a scoping document during planning, so many projects begin without agreed boundaries.
- Only 65% actively use a project schedule to manage the work.
- One in five project managers do not regularly engage in risk management, leaving problems to surface on their own.
The baseline gap is the one that hurts scheduling most. Without fixed start and end dates to compare against, a slip is invisible until it is too late. A clear project timeline is the baseline most missed projects never had.
Why projects fail: the biggest challenges
When asked to name their biggest project management challenges, respondents pointed to (Wellingtone, 2026):
- Attempting to run too many projects at once (the number one challenge, as it has been for years).
- Frequent changes to scope.
- Poor resource management.
- Inconsistency of approach across projects.
- Poorly trained project sponsors, now among the top five.
Notably, poorly trained project managers, long a top-two problem, has fallen down the list, suggesting training has improved while the harder organisational problems remain.
Why projects fail: no visibility
You cannot fix what you cannot see, and many teams cannot see their projects clearly (Wellingtone, 2026).
- 44% have no access to real-time project KPIs (only 40% do, and 16% aren’t sure).
- 72% spend half a day or more every month manually collating project reports, so status data is stale by the time it is read.
- 22% still run projects on Microsoft Excel, and a further 11% use no project management tool at all, so a third are working with a spreadsheet or nothing.
- 44% are dissatisfied with their organisation’s project management maturity, and only 35% are satisfied.
Projects on the brink
Not every at-risk project fails, and the difference often comes down to how teams respond (PMI, 2025).
- Nearly half of ultimately successful projects (45%) were at material risk of failure at some point before completion.
- Projects run without a clear vision scored a negative success score of -18, a strong marker of likely failure.
- The recovery actions that pulled projects back hardest were adapting to external changes (+34 to the success score) and communicating challenges to stakeholders (+29), both well ahead of simply adding resources (+17) or pushing the timeline (+11).
The lesson in the recovery data: when a project wobbles, adapting and communicating beat quietly moving the deadline.
FAQs
In PMI’s 2025 research, 13% of projects were outright failures and 37% had mixed results, so only half were clear successes. Wellingtone’s 2026 data shows only 36% of organisations reliably finish on time.
The data points to missing fundamentals rather than bad luck: a third of projects are never baselined, around a quarter run without a defined methodology, and one in five project managers skip regular risk management (Wellingtone, 2026).
Only 36% of organisations mostly or always complete their projects on time, and 49% do so on budget, according to Wellingtone’s 2026 State of Project Management.
The most cited challenge is attempting to run too many projects at once, followed by frequent scope changes and poor resource management (Wellingtone, 2026).
They are drawn from Wellingtone’s State of Project Management 2026 and PMI’s 2025 Project Success research, two large surveys of project management practitioners.